

Fashion
Global polyester production climbs while cotton declines and viscose holds steady


Translated by
Nazia BIBI KEENOO
Published
September 22, 2025
Textile Exchange‘s annual report indicates that global fibre production is expected to remain on an upward trajectory in 2024, with synthetic fibres steadily widening the gap with natural materials, while cellulosic (wood-pulp-based) fibres are expected to hold steady. The share of recycled fibres has not increased either, except in the wool market.
In 2024, the volume of fibre produced worldwide rose by 6.5% to 132 million tonnes. Synthetic fibres accounted for 69% of this total, up nine points on the 2020 level, with polyester alone accounting for 59%.
Having already reached a 57% share in 2023, polyester continued to gain ground, reaching a total of 78 million tonnes in 2024. Production of recycled polyester increased from 8.9 to 9.3 million tonnes. Polyamide (nylon), the second most-produced synthetic fibre, accounts for just 5% of global fibre production.
Whereas cotton accounted for 20% of fibre production in 2023, it fell to 19% in 2024, with 24.1 million tonnes of virgin cotton. Textile Exchange notes, however, that 34% of cotton produced is now certified to sustainability standards, compared with 28% the previous year. The share of recycled cotton remains stable at 1%, at 300,000 tonnes.

Other plant-based fibres account for 6.9 million tonnes of production. This market is dominated by jute (54%), followed by cotton fibre (26%), flax (5%), and hemp (5%). These two bast fibres, flax and hemp, thus account for 0.3% and 0.2%, respectively, of global fibre production.
Cellulosics, the third major fibre family (obtained through the chemical transformation of plant-based raw materials), maintained their market share, with viscose, acetate, lyocell, modal and cupro accounting for 6% of global fibre production, at 8.4 million tonnes (+6.4%). However, over the past year, the market share of recycled cellulosics has increased, rising from 0.7% to 1.1%, or 90,000 tonnes.
Nearly 70% of this sector’s production is now covered by the FSC (Forest Stewardship Council) and PEFC (Programme for the Endorsement of Forest Certification) forest certification programmes.
Animal fibres still account for only 1% of global fibre production, of which wool captures 0.9%, with 1.98 million tonnes of virgin wool. Within this market, the share of recycled wool has risen from 6% to 7%, with 83,000 tonnes. Cashmere (0.02%), mohair (0.004%) and alpaca (0.005%) have maintained their market shares in global fibre production.

Still within animal-derived materials, global down production rose from 626,000 to 659,000 tonnes, with ducks accounting for nearly 90%. The share of recycled down in this market is only 1%.
Although it is not a fibre, Textile Exchange does not overlook leather. Around 13.8 million tonnes were produced last year, from approximately 1.6 million animals. Global production last year comprised 9.4 million tonnes of sheep skins and 2.2 million tonnes of sheepskins. These figures are in addition to 11.5 million tonnes of goat skins and 800,000 tonnes of buffalo skins.

Excluding fibres, the report estimates global rubber production at 15 million tonnes in 2024. The share of production carried out under the FSC and PEFC forest certification programmes rose over the year from 2.9% to 3.2%.
This article is an automatic translation.
Click here to read the original article.
Copyright © 2025 FashionNetwork.com All rights reserved.













The Indian PET resin market witnessed significant week-on-week fluctuations during March-May ****. During the first week of March, Asia domestic India PET bottle flakes prices were assessed near $*.** per kg and remained largely stable on a weekly basis. However, during the second week of March, prices sharply increased to around $*.** per kg, reflecting a week-on-week rise of nearly ** per cent amid tight domestic supply conditions and reduced producer operating rates. In the third and fourth weeks of March, prices increased further to nearly $*.** per kg, marking an additional weekly gain of around * per cent. The bullish momentum continued into the first week of April, when prices touched nearly $*.** per kg, reflecting another week-on-week increase of approximately * per cent.
From mid-April onward, the market entered a correction phase as downstream polyester demand remained weak, and buyers shifted towards cautious procurement activity. During the second and third weeks of April, prices eased gradually towards $*.** per kg, indicating a weekly decline of around *–* per cent. The softer trend continued through late April and early May, with prices declining towards $*.** per kg and later $*.** per kg due to subdued polyester operating rates and sufficient domestic availability. By May **, ****, Asia domestic India PET bottle flakes prices were assessed around $*.*** per kg, reflecting an overall decline of nearly * per cent from the April peak, while Asia FOB India PET Bottle Flakes prices were reported near $*.*** per kg during the same period.

The country imported apparel worth $**.*** million during January-March ****, up **.* per cent from $**.*** million in the corresponding period of ****. The latest figures indicate that inbound apparel shipments have remained on a steady growth path since ****, according to *fashion.com/market-intelligence/texpro-textile-and-apparel/” target=”_blank”>sourcing intelligence tool TexPro.
The Russia-Ukraine war has had a significant economic impact on Georgia. The conflict triggered a large influx of Russian and Ukrainian migrants, which initially acted as an economic boon for the country. It fuelled rapid growth, lifted consumer spending, and increased demand for housing, services, textiles, and apparel. However, the war also deepened geopolitical polarisation and accelerated Georgia’s economic and energy reliance on Moscow.
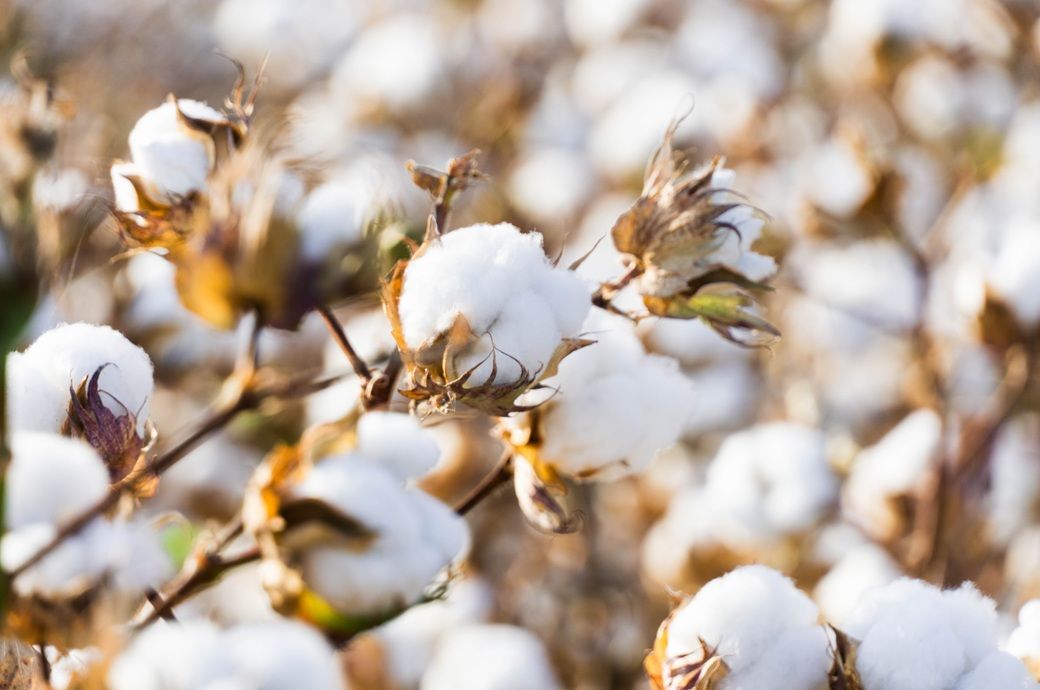
Net sales of Upland cotton for the 2025–26 marketing year totalled 131,800 RB (running bales, each weighing 226.8 kg), up sharply from 47,700 RB in the previous week and 16 per cent higher than the prior four-week average. The recovery followed a steep decline in the week ending May 7 when sales had fallen 61 per cent week-on-week and 66 per cent below the four-week average.
US Upland cotton export sales rebounded to 131,800 RB in the week ending May 14, 2026, after the previous week’s sharp fall.
Pakistan led buying, followed by Vietnam and Turkiye, while new-crop sales surged to 216,000 RB.
Shipments stayed below the recent average.
Pima sales improved slightly but remained weak, with India the top buyer and destination.
Pakistan emerged as the largest buyer during the latest reporting week with purchases of 65,300 RB, including reductions of 200 RB. Vietnam followed with 26,100 RB, including 4,500 RB switched from China, 900 RB switched from South Korea, 100 RB switched from Japan, and reductions of 4,400 RB. Turkiye booked 20,100 RB, including reductions of 100 RB, while Malaysia purchased 5,300 RB and China 3,400 RB. These gains were partly offset by reductions of 1,100 RB for Peru and 900 RB for South Korea.
New crop Upland sales for the 2026–27 marketing year rose sharply to 216,000 RB, compared with 29,700 RB in the previous week. Pakistan accounted for the bulk of new crop sales with 206,100 RB, followed by Indonesia and Turkiye at 4,500 RB each, and Mexico at 900 RB.
Upland export shipments remained broadly steady during the week. Exports totalled 289,400 RB, unchanged from the previous week but 11 per cent below the prior four-week average. Vietnam remained the leading destination with 110,800 RB, followed by Turkiye at 28,700 RB, Pakistan at 26,000 RB, Mexico at 22,100 RB, and Bangladesh at 21,200 RB.
Pima cotton sales showed a marginal weekly improvement but remained well below recent average levels. Net sales for the 2025–26 marketing year totalled 9,500 RB, up 2 per cent from the previous week but 52 per cent below the prior four-week average. India remained the largest buyer with 7,600 RB, followed by Pakistan at 1,100 RB, Peru at 500 RB, Thailand at 200 RB, and Vietnam at 100 RB.
New crop Pima sales for the 2026–27 marketing year stood at 7,700 RB, slightly below 7,900 RB in the previous week. Sales were reported for Peru at 4,000 RB and India at 3,700 RB.
Pima export shipments declined further during the week. Exports totalled 9,900 RB, down 18 per cent from the previous week and 19 per cent below the prior four-week average. India was the top destination with 4,600 RB, followed by China at 3,200 RB, Costa Rica at 1,700 RB, Pakistan at 300 RB, and Mexico at 100 RB.
Overall, the latest USDA data indicate a recovery in US Upland cotton export sales after the previous week’s sharp fall, supported mainly by strong buying from Pakistan, Vietnam, and Turkiye. However, export shipments remained below the recent average, while Pima demand continued to show weakness despite India’s sustained buying interest.
Fibre2Fashion News Desk (KUL)


Shop numbers return to growth after years of decline, say experts

Drake sets new record at ‘Iceman,’ ‘Habibti’ and ‘Maid of Honour’

Patti LaBelle on being called a legend: “I have earned it”

-

 Entertainment1 week ago
Where Pete Davidson, Elsie Hewitt stand after breakup: Details revealed
-

 Politics1 week ago
Rising diesel costs from Iran war strain US school budgets
-

 Tech1 week ago
Why Is Your Grill So Dumb? The Best Grills Set Temp Like an Oven
-

 Tech1 week ago
This Solar-Powered Smart Sprinkler Keeps My Lawn Watered Without Any Power Cables
-
 Fashion1 week ago
RMG trade bodies seek policy support from Bangladesh PM
-

 Fashion1 week ago
India calls for aligning standards, customs procedures with Africa
-

 Fashion6 days ago
Nigeria Kwara Garment Factory, KWS Garment Production Village ink pact
-

 Sports1 week ago
Pakistan steady after Das ton | The Express Tribune